
During today’s matinee matchup against the Rockies, the Mets muddled their way to a 2-1 loss while going 1-9 with runners in scoring position, causing announcers Keith Hernandez and Gary Cohen to marvel at the team’s inability to hit with RISP.
Over the three game series with St. Louis that concluded yesterday, New York hitters went 4-33 with RISP, good for a .121 average. Those three games are part of a dismal stretch of fifteen games during which the team has hit .155 with RISP. Unfortunately, this slump isn’t really much of a slump at all—the Mets’ yearlong average with RISP is an abysmal .206.
Cohen remarked that the Mets’ futility with RISP couldn’t be a fluke nearly four months into the season. Is this the case, or can fans hope for an improvement as the team nears the stretch run?
The mean batting average with runners in scoring position in MLB is .257, with a standard deviation of .0204. The Mets’ .206 average is 2.5 standard deviations below the mean, so given a normal distribution, there’s a 0.6% chance that their average with RISP could be .206 or lower.
If it’s so improbable that the Mets are this bad, then it appears that the team is bound to improve. However, it isn’t as simple as it seems. Although the Mets are tremendously unlucky when compared to the rest of the league’s stats, it’s a limited comparison. New York is starting off from a much lower baseline than the rest of the league because its average in all situations is a mere .238, worst in MLB, while league average is .255, with a standard deviation of .12. Since New York starts off 1.4 standard deviations below the mean, let’s subtract that from the original 2.5, leaving us with 1.1. Now, instead of a minuscule probability of .006 that the Mets are this bad, there’s a comparatively huge .136. In fact, in a thirty team league, it’s overwhelmingly likely that a team does as poorly with runners in scoring position as the Mets.
Those last two paragraphs were more based on intuition rather than hard statistics. Let’s take a look at it through a more official lens.
First we need to find a normalized statistic that prevents uneven baselines from affecting the numbers. I’ll use this simple formula: RISP Avg. – Normal Avg. RISP Avg. refers to a team’s average with runners in scoring position while Normal Avg. refers to a team’s overall seasonal average (which includes its at bats with RISP). This formula excises other variables and hones in on exactly what we’re looking for.
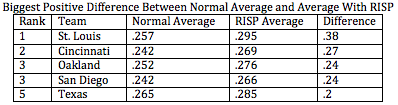
Here are the teams with the biggest positive difference between their normal average and their average with RISP.
And here are the teams with with the biggest negative difference between their normal average and their average with RISP.

There are a couple of takeaways. First, there must be something in the New York water that causes its baseball teams to wilt with runners in scoring position, as the Mets and Yankees have the two largest negative differentials in MLB. Second, although the Mets have the worst difference in the league, the Yankees and Diamondbacks are both in the same neighborhood , while on the positive side, the Cardinals have an even bigger differential than the Mets. Accordingly, it’s safe to conclude that while the Mets have been unlucky this year, they haven’t been exceptionally unfortunate.
This only proves that the Mets haven’t been especially unlucky so far, meaning that there’s no guarantee that things get better because they can’t get any worse. However, we haven’t identified if these statistics have any predictive value. After over an hour of frenzied googling and trying to manipulate various baseball stats websites to give me half season splits along with RISP numbers, I was unable to find any statistics that would allow us to determine the predictive value of what we’ve seen so far. However, I’ll continue to look, and if I manage to find the stats, another article will soon be on the way.
All statistics accurate through July 27.

Thank you for this excellent summary explaining WHY my team is so bad. Shoulda kept the Murph!